Mar. 1, 2002
Severe drought threatens Northeast's coastal areas and largest cities, Cornell climate center says
ITHACA, N.Y. --
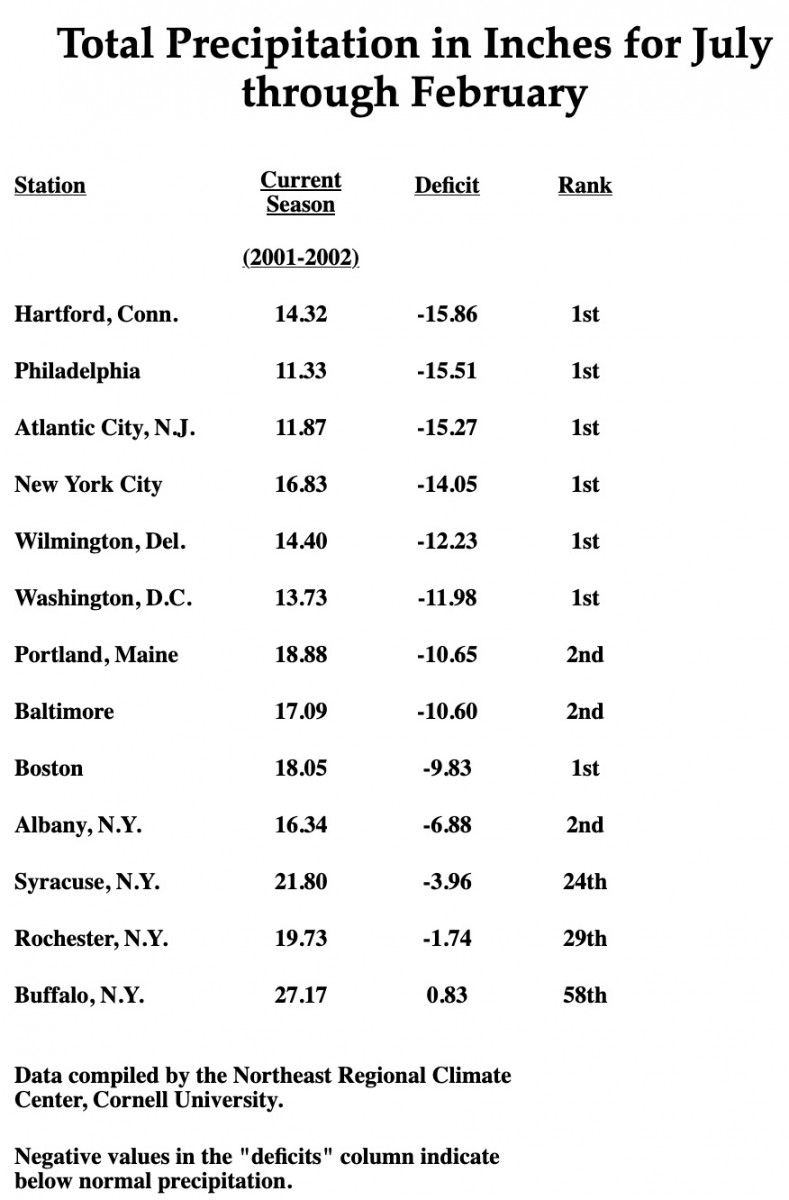
Many coastal and large urban areas in the Northeast are facing their worst precipitation deficits (July through February) since official climatological record-keeping began more than a century ago, say experts at the Northeast Regional Climate Center at Cornell University.
The severest drought faces those communities experiencing at least a 15-inch precipitation deficit since last July, including most of New Jersey, southeastern New York state, Connecticut, Rhode Island and Massachusetts, the climate center says.
"If the precipitation deficit continues in these areas, then we could be heading into a serious water supply problem," says Keith Eggleston, senior climatologist at the center.
Over the early days of March, rain and snow is expected in parts of the Northeast, says Eggleston, but it will not be enough instantly to relieve the drought-stricken areas. "Obviously, anything that we get now will help, but it will really take a few months of above-normal precipitation to bring everything back to normal," he says.
Hartford, Philadelphia, Atlantic City and New York City are the most populous areas facing severe water deficits, says Eggleston. Hartford has 15.86-inch water deficit, based on the average amount of precipitation for the July-February time period. Philadelphia has a 15.51-inch deficit; Atlantic City, a 15.27-inch deficit; and New York City a 14.05-inch deficit.
| Total Precipitation in Inches for July through February | |||||
| Station | Current Season (2001-2002) | Deficit | Rank | ||
| Hartford, Conn. | 14.32 | -15.86 | 1st | ||
| Philadelphia | 11.33 | -15.51 | 1st | ||
| Atlantic City, N.J. | 11.87 | -15.27 | 1st | ||
| New York City | 16.83 | -14.05 | 1st | ||
| Wilmington, Del. | 14.40 | -12.23 | 1st | ||
| Washington, D.C. | 13.73 | -11.98 | 1st | ||
| Portland, Maine | 18.88 | -10.65 | 2nd | ||
| Baltimore | 17.09 | -10.60 | 2nd | ||
| Boston | 18.05 | -9.83 | 1st | ||
| Albany, N.Y. | 16.34 | -6.88 | 2nd | ||
| Syracuse, N.Y. | 21.80 | -3.96 | 24th | ||
| Rochester, N.Y. | 19.73 | -1.74 | 29th | ||
| Buffalo, N.Y. | 27.17 | 0.83 | 58th | ||
| Data compiled by the Northeast Regional Climate Center, Cornell University. | |||||
| Negative values in the "deficits" column indicate below normal precipitation. | |||||
![]() |
| Copyright © Cornell University A high-resolution copy of this graphic (2314 x 2189 pixels, 917K) is available here. |
Total Precipitation in Inches for July through February
Station
Current Season
(2001-2002)
Deficit
Rank
Hartford, Conn.
14.32
-15.86
1st
Philadelphia
11.33
-15.51
1st
Atlantic City, N.J.
11.87
-15.27
1st
New York City
16.83
-14.05
1st
Wilmington, Del.
14.40
-12.23
1st
Washington, D.C.
13.73
-11.98
1st
Portland, Maine
18.88
-10.65
2nd
Baltimore
17.09
-10.60
2nd
Boston
18.05
-9.83
1st
Albany, N.Y.
16.34
-6.88
2nd
Syracuse, N.Y.
21.80
-3.96
24th
Rochester, N.Y.
19.73
-1.74
29th
Buffalo, N.Y.
27.17
0.83
58th
Data compiled by the Northeast Regional Climate Center, Cornell University.
Negative values in the "deficits" column indicate below normal precipitation.
![]() |
| Copyright © Cornell University A high-resolution copy of this graphic (2314 x 2189 pixels, 917K) is available here. |
-30-


Digg
Facebook
Google
LinkedIn
Reddit
StumbleUpon
Twitter