Apps put the power of data in hands of New York schools
By Sarah Thompson
A new set of simple Web and iPad applications from Cornell are helping New York state school districts take the guesswork out of complex decision-making.
The New York State Center for Rural Schools at Cornell's College of Agriculture and Life Sciences has released three data analysis tools -- Budget Playground, School Benchmarker and Reorganizer -- that allow school officials to instantly create scenarios and projections based on real education data with the click of a mouse or touch of a screen.
In this time of fiscal stress, heightened academic requirements and a property tax cap, budget scenario planning has become all the more important for local leaders, said John Sipple, associate professor of development sociology and director of the center.
"The core purpose of this project is to put data in the hands of local decision makers and make it very easy and useful," Sipple said. "All state education data is publicly available on state government websites, but for the vast majority of schools, the data is not useful. These tools have transformed data to be graphical, quick and easy to use."
School Benchmarker allows school leaders to quickly find benchmark schools with similar demographics and set achievable academic targets based on demonstrated best-in-class performance. The app, which includes data for all public schools in New York except those in New York City, also provides contact information for benchmark schools so leaders can follow up with them directly.
The Budget Playground app lets users create multiyear budget scenarios and quick, real-time projections. Users instantly see the effects of changes in tax rates, enrollment, state funding or salaries.
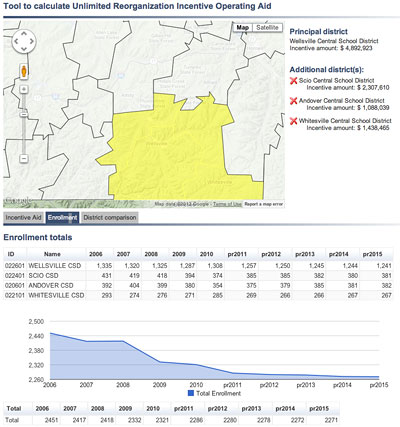
With Reorganizer, users select one or more school districts on a map to see the effects of potential mergers. The app shows the amount of state incentive aid offered, current and projected enrollment of the enlarged district as well as other fiscal and demographic information.
These applications were developed over four years by a collaboration between the center, Cornell's Program on Applied Demographics, Cornell's Community and Regional Development Institute, the Rural Schools Association of New York State and Prism Decision Systems LLC.
"Our overarching goal is the transformation of how statewide education data is being used by schools," said Sean Brady, president of Prism Decision Systems LLC. "Previously, education data was used primarily for reporting. It was rarely used to support decision making."
Sipple said only a few schools have the resources to perform these analyses; that is why he and his team believe it is important to make the Cornell data tools freely available.
"Anyone can use the apps -- parents, the media, mayors, staffers. We see value in sharing data across boundaries and communities," Sipple said. "These are public data, but we're making the data much more accessible to people."
Sarah Thompson is a freelance writer based in Trumansburg, N.Y.
Media Contact
Get Cornell news delivered right to your inbox.
Subscribe