Radar provides first 3-D views of moon's frigid poles, indicating sites for ice deposits, say Cornell astronomers
By David Brand
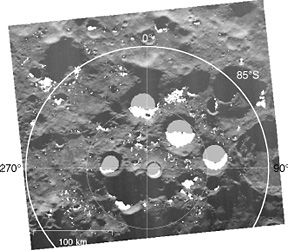
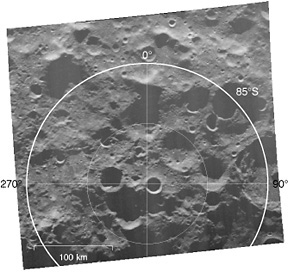
The hidden poles of the moon have been revealed by Cornell University and Jet Propulsion Laboratory researchers working with the radar antennas of NASA's Deep Space Network at Goldstone, Calif. The south pole image, in particular, reveals a chaotic surface, with deep craters that are in permanent shadow from the sun and which are potential repositories for water ice.
These first three-dimensional topographic images of the lunar polar regions will provide essential data for the proposed crash of the orbiting Lunar Prospector spacecraft into the lunar south pole in late July. If NASA approves, the controlled, high-speed dive into a massive crater, 50 kilometers (32 miles) across and 2.5 kilometers (1.5 miles) deep, will attempt to provide absolute proof of the existence of water on the moon.
The new images, obtained through a technique called radar interferometry, are published in the latest edition (June 4) of Science magazine. They are a leap forward in settling the "significant argument" about the existence of water ice on the moon, says Donald Campbell, professor of astronomy at Cornell, and one of the paper's authors.
In the solar system, ice has a unique, and not totally understood, "signature" when probed by radar beams. This was first discovered by Campbell and others when they used the radar system of the Cornell-operated Arecibo Observatory in Puerto Rico to get radar echoes from the icy Galilean satellites of Jupiter.
In 1996, researchers working with radar data from the orbiting lunar spacecraft Clementine reported indications of ice at the south pole of the moon. However, in 1997 researchers, Campbell among them, published a paper in Science reporting on Arecibo's radar imaging of the lunar poles that showed no evidence of ice. Both the Clementine and Arecibo radars would only have detected ice if it had been in the form of large chunks or slabs. The absence of an Arecibo radar detection did not preclude ice being present in small chunks or crystals mixed in with the lunar "soil."
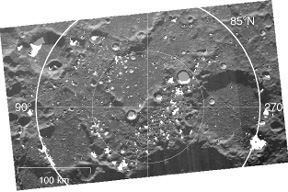
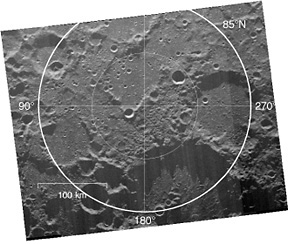
Last year, the neutron spectrometer aboard the Lunar Prospector orbiter, launched in January 1998, detected significant deposits of hydrogen at the moon's north and south poles. This was interpreted as indicating the presence of water ice, since hydrogen in water molecules is thought to be the most likely source of the element at the poles. However, without detailed topographic maps of the poles, it was not possible to identify potential ice-containing regions -- so-called cold traps, or areas where the sun never shines and the temperature hovers around 100 degrees Kelvin (minus 280 degrees Fahrenheit).
Using these new topographical maps, NASA is considering trying to settle the debate about the existence of water on the moon with a controlled crash of the Lunar Prospector spacecraft, which is nearing the end of its useful life. The orbiter has detected significant amounts of hydrogen in the chosen south pole crash site, the informally named Mawson crater. The hope is that the kinetic energy from the plunge into the crater will evaporate the water ice into a plume detectable from terrestrial and space telescopes. "In order to impact the spacecraft at the desired location, very accurate knowledge of the topography is needed," says Campbell, who is also the associate director of the National Astronomy and Ionosphere Center, headquartered at Cornell, which operates Arecibo for the National Science Foundation.
Says Margot: "The argument for targeting that particular crater is that it is both in permanent shadow, as shown by our radar data, and also has a high hydrogen abundance, as shown by new Lunar Prospector data. This makes it a prime candidate for water ice deposits."
To obtain the topographic features of the hidden lunar polar regions, Margot, Campbell and Martin Slade and Raymond Jurgens of JPL used the Goldstone 70-meter antenna to transmit the radar signals. Two separate 34-meter antennas, 20 kilometers (12 miles) apart at the Goldstone site, received the echoes. By comparing the images from the two antennas, Margot derived a three-dimensional digital elevation model of the lunar poles, with
measurements every 150 meters (500 feet) over the imaged area and a height accuracy of 50 meters (165 feet).
To calculate which areas were in permanent shadow, Margot wrote a computer program that calculated whether each point in the three-dimensional image would be in shadow for any allowed position of the sun. "The program simulated light rays from the sun to each point on the map and tested to see if the ray was intercepted by the surrounding topography," Margot says. "If a single light ray was received, that point was in sunlight. If not, it was in shadow."
This detailed topography, says Margot, also has applications in cratering and other, studies. "The data is of such fine resolution that we can find out much about crater shape and impact mechanics," he says.
Related World Wide Web sites: The following sites provide additional information on this news release. Some might not be part of the Cornell University community, and Cornell has no control over their content or availability.
Media Contact
Get Cornell news delivered right to your inbox.
Subscribe