Search engines will know what you want ... sooner
By Bill Steele
If you enter “Oklahoma” in a search engine, you might get a travelogue, news about the oil industry, Oklahoma State football scores or an article on Rodgers and Hammerstein musicals. What appears at the top of the list might – and should – depend on what you were actually looking for.
Web search engines, social media sites and retailers that offer you recommendations sometimes “personalize” the ranking of results by looking at your search history.
“If you buy something from Amazon tonight, when you come back tomorrow they may show you related products,” explained Wenlei Xie, a graduate student in the field of computer science. “They have computed the rankings offline, based on your choice.”
But now Xie and colleagues have refined the algorithm (the underlying design of the computer program) to make it faster so search engines can become interactive, responding to your interests in real time. The new method is, they say, “breaking a decade-old performance barrier.” The techniques could be applied in social media and private and commercial databases as well as in Web searches and recommendation systems.
Xie is first author of a paper describing the innovation presented at the 21st ACM SIGKDD Conference on Knowledge Discovery and Data Mining, last summer in Sydney, Australia, where it received the Best Student Paper Award. He collaborated with Johannes Gehrke, the Tisch University Professor of Computer Science; David Bindel, assistant professor of computer science; and principal research scientist Alan Demers.
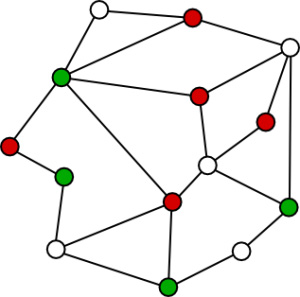
Your search history might be visualized as a “graph.” In computer science, that’s not a squiggly line that shows how your company’s profits have been falling off, but rather a sort of concept map in which small circles called “nodes” represent items of information, connected by lines called “edges” that represent relationships. (A computer doesn’t use pictures. It just stores the data items and links between them. Humans draw a graph to help in thinking about it.)
To examine your history, the computer does a “random walk” through the graph until it has read out all the information. To guide the walk, nodes and edges may be “weighted.” Nodes may record how many times you have visited that website or looked at that product. Edges may show the importance of a relationship. In social media, for example, “spouse” is a stronger relationship than “co-worker.”
With a “node-weighted” algorithm, a walker landing on low-rated nodes could “teleport” to others at random, ending up with information on just the most interesting nodes. But “edge weighting” works better, the Cornell researchers say.
On Twitter, they point out, ranking by how much two people have interests in common gives better results than just looking at the topics on which each user tweets.
There already are ranking algorithms available that use edge weights, but they’re slow. To speed it up, the researchers “reduce” the graph and make the walk faster – sort of like looking at a map of the United States that shows only interstate highways, not all the county roads and city streets.
The algorithm looks for nodes that are “correlated” – representing similar interests, and with strong connections between them. A high school student checking out colleges might visit a lot of university websites; these could be combined into one large and very important node in the simplified graph. “It’s like we can collapse a million nodes into a hundred virtual nodes,” Xie explained.
The researchers tested their method on a database of scholarly publications and a blog search system and found that it worked five orders of magnitude faster than currently used methods. They also found that their reduced model speeded up “learn to rank” systems where the computer notes which items in a list the user clicks on to get an idea of the user’s preferences.
A way to make the results even more timely, the researchers suggested, might be to do the calculations on the client side, after downloading the reduced model to the client’s computer. They would also like to update the reduced model continuously as new data comes in.
The work was supported by the National Science Foundation and the National Research Council of Norway.
Media Contact
Get Cornell news delivered right to your inbox.
Subscribe